
Introduction
In previous articles we have seen how we can enable observability in spring -boot applications. So far we can trace methods called and understand them from the outside. However, what if we want to drill down and see how long each SQL request within the method span took? In this article we will use the datasource micrometer library for that instrumentation. This library will emit metrics and traces that will help us further understand and monitor our applications. For datasource metrics, we will also use the hikariCP library as well the flexypool library. We will also enable hibernate statistics.
This article assumes that the reader knows spring boot, actuator, and observability. If not you can refer to actuator article 1, actuator article part 2, spring boot metrics and the observability article.
Flexypool
Flexypool is a library that adds metrics and flexible strategies to database Connection Pools. Usually connection pools have min and max sizes, however, flexypool introduces “overflow” as a buffer that allows the connection pool to grow beyond its max size. Whenever a connection acquisition timeout is detected, the current request won’t fail if the pool hasn’t grown to its maximum overflow size. Flexypool also emits metrics that help tune the pool e.g how the connections are used over time, the concurrent requests for connections etc.
Below is a table of the metrics flexypool provides and their descriptions.
| Metric Name | Description |
| concurrentConnectionsHistogram | Number of connections used simultaneously. |
| concurrentConnectionRequestsHistogram | Number of connections requested simultaneously. |
| connectionAcquisitionMillis | Histogram of the connection acquisition time. |
| connectionLeaseMillis | Histogram of the duration between the moment a connection is acquired and the time it gets released. |
| maxPoolSizeHistogram | The target pool size. The pool size might change if the IncrementPoolOnTimeoutConnectionAcquisitionStrategy is being used. |
| overallconnectionAcquisitionMillis | Histogram for the total connection acquire interval. This is the connectionAcquisitionMillis plus the time spent by the connection acquire strategies. |
| overgrowPoolSizeHistogram | Pool size overgrowth. The pool size might overgrow if the IncrementPoolOnTimeoutConnectionAcquisitionStrategy is being used. |
| retryAttemptsHistogram | Retry attempts counts. This is incremented by the RetryConnectionAcquisitionStrategy. |
The metrics above can help us have the needed information to tune our pools.
Datasource Micrometer
This library intercepts all queries, Connection, Statement and ResultSet method calls and emits metrics and traces. Under the hood, it uses the datasource proxy library to intercept the calls. The metrics emitted by datasource proxy are listed below.
jdbc_connection_active_seconds histogram
jdbc_connection_acquired_total counter
jdbc_connection_active_seconds_gcount gauge
jdbc_connection_active_seconds_gsum gauge
jdbc_connection_active_seconds_max gauge
jdbc_connection_commit_total counter
jdbc_connection_seconds histogram
jdbc_connection_seconds_max gauge
jdbc_connections_active gauge
jdbc_connections_idle gauge
jdbc_connections_max gauge
jdbc_connections_min gauge
jdbc_query_active_seconds histogram
jdbc_query_active_seconds_gcount gauge
jdbc_query_active_seconds_gsum gauge
jdbc_query_active_seconds_max gauge
jdbc_query_seconds histogram
jdbc_query_seconds_max gauge
jdbc_result_set_active_seconds histogram
jdbc_result_set_active_seconds_gcount gauge
jdbc_result_set_active_seconds_gsum gauge
jdbc_result_set_active_seconds_max gauge
jdbc_result_set_seconds histogram
jdbc_result_set_seconds_max gauge
HikariCP
HikariCP is widely considered as the fastest database connection pooling library. HikariCP also emits metrics.
Below are the metrics that hikariCP emits.
hikaricp_connections gauge
hikaricp_connections_acquire_seconds histogram
hikaricp_connections_acquire_seconds_max gauge
hikaricp_connections_active gauge
hikaricp_connections_creation_seconds histogram
hikaricp_connections_creation_seconds_max gauge
hikaricp_connections_idle gauge
hikaricp_connections_max gauge
hikaricp_connections_min gauge
hikaricp_connections_pending gauge
hikaricp_connections_timeout_total counter
hikaricp_connections_usage_seconds histogram
hikaricp_connections_usage_seconds_max gauge
Setup
In addition to the core observability setup explained in the the observability article., we will enable hibernate statistics then add dependencies for the datasource proxy and flexypool libraries.
To get the hibernate statistics metrics, we need the following dependency on the classpath.
		<dependency>
			<groupId>org.hibernate.orm</groupId>
			<artifactId>hibernate-micrometer</artifactId>
			<version>6.6.11.Final</version>
		</dependency>
We also need to tell spring boot to expose them (in this case via http).
spring:
  jpa:
    properties:
      hibernate:
        generate_statistics: true
Below is the datasource proxy dependency.
		<dependency>
			<groupId>net.ttddyy.observation</groupId>
			<artifactId>datasource-micrometer-spring-boot</artifactId>
			<version>1.1.0</version>
		</dependency>
Next is the flexypool dependency
		<dependency>
			<groupId>com.vladmihalcea.flexy-pool</groupId>
			<artifactId>flexy-hikaricp</artifactId>
			<version>3.0.2</version>
			<exclusions>
				<exclusion>
					<groupId>com.vladmihalcea.flexy-pool</groupId>
					<artifactId>flexy-dropwizard-metrics</artifactId>
				</exclusion>
			</exclusions>
		</dependency>
		<dependency>
			<groupId>com.vladmihalcea.flexy-pool</groupId>
			<artifactId>flexy-micrometer-metrics</artifactId>
			<version>3.0.2</version>
		</dependency>
We want to use the micrometer library, so we exclude the flexy-dropwizard-metrics that comes included in the flexypool library and add the flexy-micrometer-metrics library.
Let’s have a look at the datasource configuration. Below is the hikariCP configuration. The properties are loaded from the application.yml file.
    @Bean
    @ConfigurationProperties(prefix = "spring.datasource.hikari")
    HikariConfig hikariConfig(DataSourceProperties dataSourceProperties) {
        final HikariConfig hikariConfig = new HikariConfig();
        hikariConfig.setPassword(dataSourceProperties.getPassword());
        hikariConfig.setUsername(dataSourceProperties.getUsername());
        hikariConfig.setJdbcUrl(dataSourceProperties.getUrl());
        return hikariConfig;
    }
Next, let’s have a look at Flexypool and datasource proxy configurations.
    @Bean
    public FlexyPoolConfiguration<HikariDataSource> flexypoolConfiguration(HikariConfig hikariConfig) {
        final HikariDataSource hikariDataSource = new HikariDataSource(hikariConfig);
        return new FlexyPoolConfiguration.Builder<>(UUID.randomUUID().toString(), hikariDataSource, HikariCPPoolAdapter.FACTORY)
                .setMetricsFactory(MetricsFactoryResolver.INSTANCE.resolve())
                .setConnectionProxyFactory(ConnectionDecoratorFactoryResolver.INSTANCE.resolve())
                .setMetricLogReporterMillis(TimeUnit.SECONDS.toMillis(5))
                .setMetricNamingUniqueName(UniqueNamingStrategy.INSTANCE)
                .setJmxEnabled(true)
                .setJmxAutoStart(true)
                .setConnectionAcquisitionTimeThresholdMillis(50L)
                .setConnectionLeaseTimeThresholdMillis(250L)
                .build();
    }

    @Bean
    public DataSource dataSource(FlexyPoolConfiguration<HikariDataSource> flexypoolConfiguration, ObservationRegistry observationRegistry, Tracer tracer) {
        final FlexyPoolDataSource<HikariDataSource> flexyPoolDataSource = new FlexyPoolDataSource<>(
                flexypoolConfiguration,
                new IncrementPoolOnTimeoutConnectionAcquisitionStrategy.Factory(5),
                new RetryConnectionAcquisitionStrategy.Factory(2)
        );
        ObservationRegistry.ObservationConfig observationConfig = observationRegistry.observationConfig();
        observationConfig.observationHandler(new ConnectionTracingObservationHandler(tracer));
        observationConfig.observationHandler(new QueryTracingObservationHandler(tracer));
        observationConfig.observationHandler(new ResultSetTracingObservationHandler(tracer));
        DataSourceObservationListener listener = new DataSourceObservationListener(observationRegistry);
        return ProxyDataSourceBuilder.create(flexyPoolDataSource).listener(listener).methodListener(listener).build();
    }
On line 20, the strategy IncrementPoolOnTimeoutConnectionAcquistionStrategy increments the target connection pool maximum size if there’s a timeout during connection acquisition. It takes a maxOverflowPoolSize which sets the maximum limit to which a target connection pool can stretch. A value of 5 is passed in. This means upon reaching the maximum pool size, a maximum of 5 additional connections can be created.
On line 21, the strategy RetryConnectionAcquisitionStrategy instructs FlexyPool to make a maximum of 2 retry attempts to acquire a connection from the pool.
In lines 24 to 26 we add tracing to the Connection, Query and Resultset as part of the datasource proxy configuration.
For a bigger picture, we wrap the HikariCP datasource within flexypool and in turn wrap flexypool within the datasource proxy.
A typical trace of the fetch products endpoint in the accompanying demo app is depicted below.
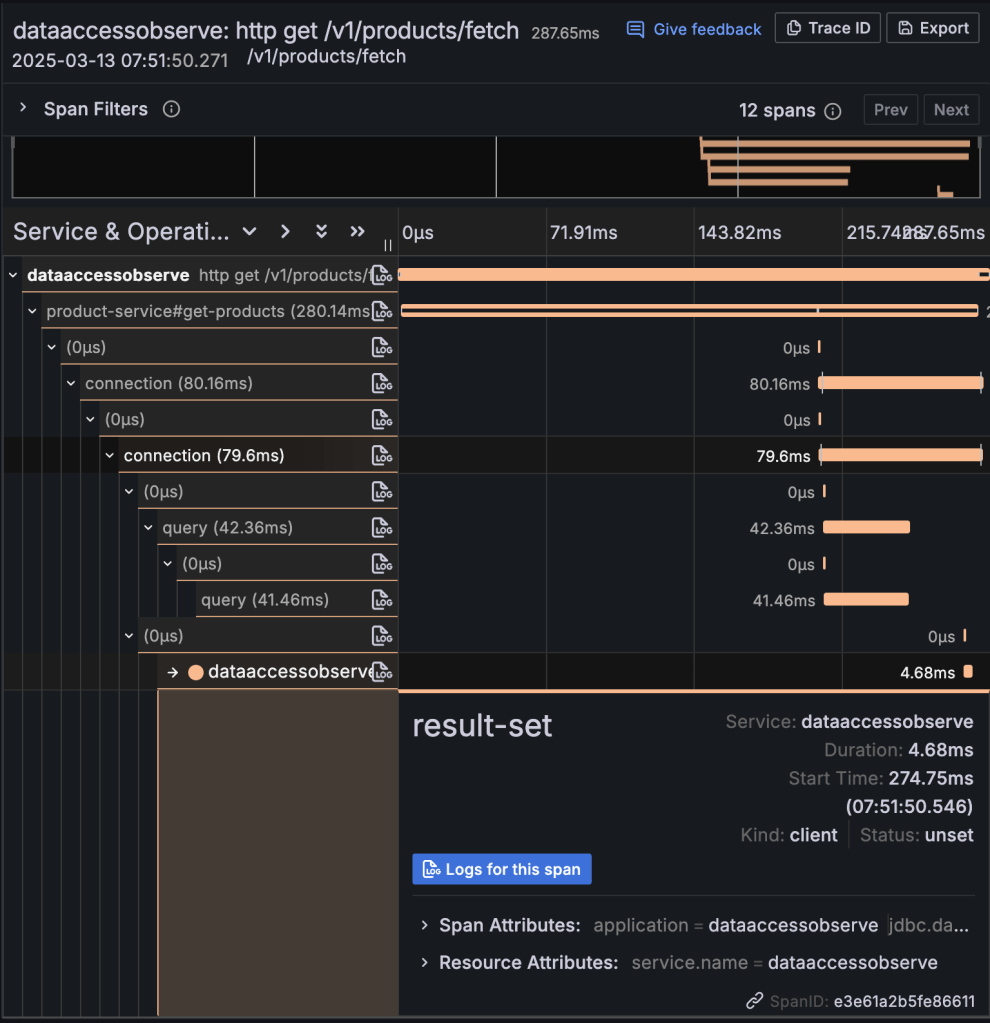
Above we can see connection and query spans within the getProducts span of the productService.
Conclusion
We have seen how to zoom into our data access by configuring it with observability. Not only can we trace method calls but also individual SQL queries within a method call as well as get the accompanying metrics. The accompanying code can be accessed here.

Leave a comment