
Introduction
In part 1 of this two-part tutorial, we had a look at how to add actuator to your project, a general overview of the endpoints that are auto-configured and how to secure them. Here we will have a look specifically at the health, and info endpoints. We will see how to configure them and get more data from them as well as how to write custom endpoints.
Health Endpoint
As already mentioned in part 1, by default the health endpoint is accessible through “actuator/health”. This endpoint just shows the aggregate status unless configured to show more. The health of the system is actually an aggregation of the contribution of one or more health indicators. The health endpoint can be configured to show details or components and to restrict who can view the exposed details/components
management.endpoint.health.show-details= {never, when-authorized, always}

management.endpoint.health.show-components= {never, when-authorized, always}
The 3 possible values are:
- never (Details are never shown)
- when-authorized (Details are shown only to authorized users. Authorized roles can also be configured)
- always (Details are shown to all users)
Let us configure the endpoint to show details (components as well) just to users with the role ENDPOINT_DETAILS:
    # shows components, status and details
    management.endpoint.health.show-details= when-authorized
    management.endpoint.health.roles= ENDPOINT_DETAILS
In part 1 security was configured such that only ENDPOINT_ADMIN role could access actuator endpoints. With the above configuration, a user only with the ENDPOINT_ADMIN role will see the health endpoint but will not be able to see the details. The user will need to have ENDPOINT_ADMIN as well as ENDPOINT_DETAILS roles in order to see the details. The details endpoint will return JSON data that looks like the content depicted below
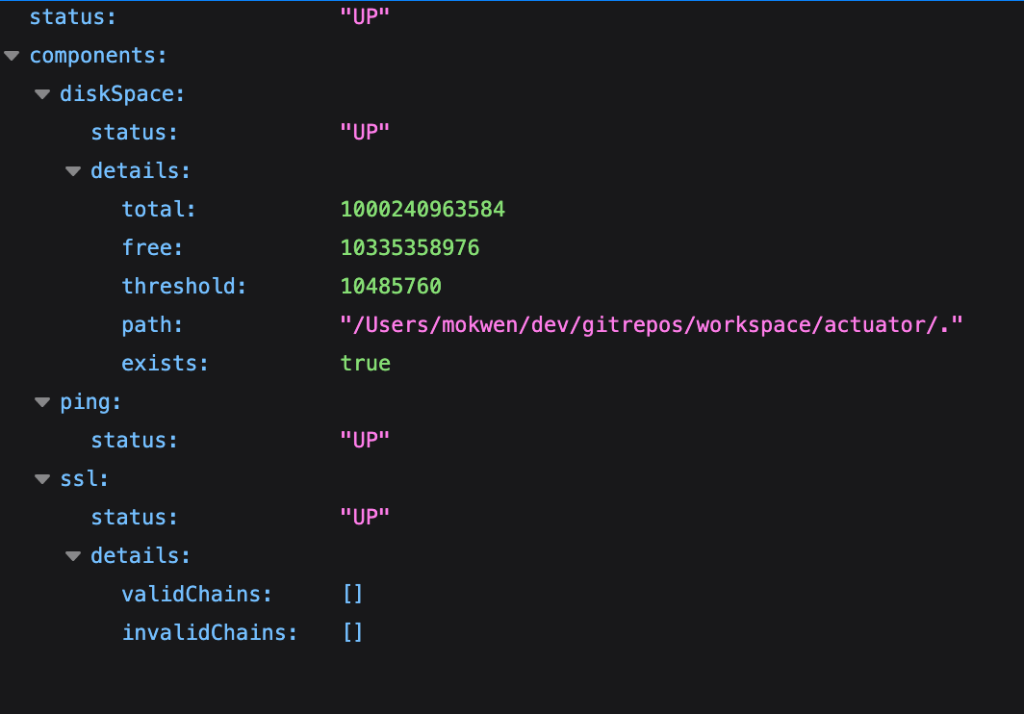
You can see that there are 3 health indicators contributing to the aggregate health; namely the SslHealthIndicator, PingHealthIndicator and DiskSpaceHealthIndicator. Each has the status “UP”, so the aggregate status (located at the top) is “UP”.
How the aggregate status is determined
Spring boot has predefined statuses that can be returned by health indicators. The statuses are also ordered by default: DOWN, OUT_OF_SERVICE, UP then UNKNOWN. Spring first collects the statuses from all contributing health indicators. The lowest status is taken to represent the aggregate status. In our case all were up so “UP” is the aggregate. Had it been any was “OUT_OF_SERVICE”, that would have been the aggregate since it has a lower order than “UP”.
Auto-configured health indicators
SslHealthIndicator, PingHealthIndicator and DiskSpaceHealthIndicator are health indicators that are added by default. There are a number of other indicators that spring conditionally adds such as DataSourceHealthIndicator, which is added if a dataSource bean is configured.
Custom health endpoint
Spring also gives the possibility to create and register custom health indicators. Custom indicators could be used to provide the health of down stream services as well as other components that could be turned on or off. Below is sample code to create an endpoint
import org.springframework.boot.actuate.autoconfigure.health.ConditionalOnEnabledHealthIndicator;
import org.springframework.boot.actuate.health.AbstractHealthIndicator;
import org.springframework.boot.actuate.health.Health;
import org.springframework.stereotype.Component;

import java.util.concurrent.atomic.AtomicInteger;

@Component
@ConditionalOnEnabledHealthIndicator("custom_data_source")
public class CustomDataSourceHealthIndicator extends AbstractHealthIndicator {
    private final AtomicInteger counter = new AtomicInteger();

    @Override
    protected void doHealthCheck(Health.Builder builder) throws Exception {
        final int status = counter.incrementAndGet() % 2;
        switch (status) {
            case 0 -> builder.down();
            case 1 -> builder.up();
        }
    }
}- The above health indicator will contribute to the health endpoint as is with the id “custom_data_source”.
- Open the health endpoint and you will see customDataSource as one of the indicators.
- If you want to exclude it add management.health.custom_data_source.enabled=false
Info Endpoint
The info endpoint is an aggregation endpoint that exposes information about the application. The aggregator collects and displays information from implementations of the InfoContributor interface. Spring boot has 7 built-in implementations of the InfoContributor interface. The contributors include BuildInfoContributor, EnvironmentInfoContributor, GitInfoContributor, JavaInfoContributor, OsInfoContributor, ProcessInfoContributor, and SslInfoContributor. For the “/info” endpoint to display information, certain prerequisites have to be met.
Configuring the BuildInfoContributor
For build information to be displayed, the project needs a META-INF/build-info.properties resource. This can be achieved by configuring the “build-info” goal in the spring-boot-maven-plugin. The goal creates the META-INF/build-info.properties file in the target folder.
<build>
  <plugins>
    <plugin>
      <groupId>org.springframework.boot</groupId>
      <artifactId>spring-boot-maven-plugin</artifactId>
      <executions>
        <execution>
	  <goals>
	    <goal>build-info</goal>
	  </goals>
	</execution>
      </executions>
    </plugin>
  </plugins>
</build>
Configuring the GitInfoContributor
Adding the git-commit-id-maven-plugin plugin generates git information that leads to the GitInfoContributor information being added to the InfoEndpoint
<plugin>
  <groupId>io.github.git-commit-id</groupId>
  <artifactId>git-commit-id-maven-plugin</artifactId>
</plugin>
Configuring the other built-in InfoContributors
management.info.env.enabled= true
management.info.java.enabled= true
management.info.os.enabled= true
management.info.ssl.enabled= true
management.info.process.enabled= true
All properties added to application.properties/yaml with the prefix “info.” will appear as part of the EnvironmentInfoContributor information without the “info.” prefix. The properties will also appear with the “info.” prefix in the “/env” endpoint.
Other Endpoints
The endpoints /env, /configprops and /quartz mask the output of their values. The /env endpoint can be configured to show values like below:
management.endpoint.env.show-values=when-authorized
management.endpoint.env.roles=ENDPOINT_DETAILS
The configuration above is very similar to the one we previously did for the “/health” endpoint. An authenticated user with the role ENDPOINT_DETAILS is able to see the unmasked values of the “/env” endpoint.
Custom Endpoints
In order to create an endpoint that contributes data to an aggregate endpoint, you need to create a bean that implements the base interface for the endpoint. For example for “/health” you need to implement the HealthIndicator interface (see the example in the health section). An example InfoContributor can be seen below:
@Component
@ConditionalOnEnabledInfoContributor("custom")
public class CustomInfoContributor extends SimpleInfoContributor {
    public CustomInfoContributor() {
        super("dev", "mokwen");
    }
}
Before seeing how to write custom endpoints let us first see a couple of annotations that can help us achieve that goal:
@Endpoint
Use the @Endpoint annotation to create an endpoint that supports both HTTP and JMX protocols
@WebEndpoint
This is an annotation that makes an endpoint accessible only over HTTP.
@JmxEndpoint
Represents an endpoint that is accessible only over JMX
@ServletEndpoint, @ControllerEndpoint and @RestControllerEndpoint
These annotations have all been deprecated and will be soon removed.
Below is a sample web endpoint that demonstrates the exposure of HTTP GET, POST and DELETE endpoints
@Component
@WebEndpoint(id = "cusinfo")
public class CustomWebEndpoint {

    private Map<String, String> properties = new ConcurrentHashMap<>();

    @ReadOperation
    public Map<String, String> readProps() {
        return properties;
    }


     @ReadOperation
    public ResponseEntity<String> sysProp(@Selector String property) {
        String output = String.format("%s : %s", property, System.getProperty(property));
        return ResponseEntity.ok()
                             .header(HttpHeaders.CONTENT_TYPE, "text/plain; charset=utf-8")
                             .body(output);
    }


    @WriteOperation
    public Map<String, String> writeProp(@Selector String key, @Nullable String value) {
        properties.put(key, value);
        return properties;
    }


    @DeleteOperation
    public Map<String, String> delete(@Selector String property) {
        properties.remove(property);
        return properties;
    }

}
Some things to note about the class:
- The @WebEndpoint(id = “cusinfo”) annotation leads to the creation of an endpoint named “cusinfo”.
- The readProps() method is annotated with “@ReadOperation”, effectively making it an HTTP GET endpoint. It can be accessed through the endpoint base path like so: http://localhost:8080/actuator/cusinfo
- The sysProp(@Selector String property) method is also annotated with “@ReadOperation”. Notice that it takes a parameter annotated with @Selector. It can invoked using the following URL: http://localhost:8080/actuator/cusinfo/os.name
- The writeProp(@Selector String key, @Nullable String value) method is annotated with @WriteOperation and can be invoked with an HTTP POST request. To store the key value pair “game=football”, issue the following curl command:
curl "http://localhost:8080/actuator/cusinfo/game?value=football" -X POST -H "content-type: application/json" - The delete(@Selector String property) method is annotated with @DeleteOperation and can be invoked with an HTTP DELETE request.
curl "http://localhost:8080/actuator/cusinfo/game" -X DELETE
Conclusion
In the previous article we had a general view of spring boot actuator and how to secure it. Here we focused mainly on the health and info aggregate endpoints, displaying how to tweak them, and how to add contributions that can be picked up by the aggregates. The repository can be viewed here: https://bitbucket.org/teamkribisoft/actuator. The main branch contains information relevant for part 1 and the part2 branch contains information relevant for this article.

Leave a reply to Data Access Observability – Code Major Cancel reply