Introduction
Before we move on to how observability is achieved using spring boot, let’s first define what observability means.
Observability means understanding the state of a system based on target outputs. The outputs could be logs, metrics, traces and profiles. When these outputs are co-related, examining them can give us insides of the running system.
We are going to see how spring boot helps us send out the target data types we need to understand the state of a running system as well as some tools we can use to navigate the data. The assumption is that we already have the knowledge of spring boot actuator. If not you can refer to actuator article 1 and actuator article part 2. There is also an article on spring boot metrics. That said spring boot observability sends out logging, metrics and traces in such a way that they can be co-related.
Traces
Traces give us information about a request. The information they give include the following: How long did the request take? What were the other interactions that happened and how long did they take. Each trace has a unique id. A trace itself is made of spans which hold the trace id, a unique id, the name and the operation time spent. A span refers to the various interactions that take place within a trace. A trace could help you see all the method calls (spans) that were made in a request in the right order.
Setup
We will have an overview of the tools needed to achieve our goals and how they fit in the big picture. We will also go through the configuration steps
Actuator
Actuator will provide the endpoint for the scrapping of metrics. We need it as well as the spring boot starter web dependency
		<dependency>
			<groupId>org.springframework.boot</groupId>
			<artifactId>spring-boot-starter-actuator</artifactId>
		</dependency>
		<dependency>
			<groupId>org.springframework.boot</groupId>
			<artifactId>spring-boot-starter-web</artifactId>
		</dependency>
Also add the following to your application.properties file so that actuator enables prometheus export and exposes the health, metrics and prometheus endpoints.
management.metrics.export.prometheus.enabled=true
management.endpoints.web.exposure.include=health,metrics,prometheus
management.metrics.tags.application=${spring.application.name:}
management.metrics.tags in line 3 above was deprecated in spring 3.2 then later reinstated. Line 3 is a declaration of a custom tag (aka attribute called application) that will be added to metrics that are not created by the observability API.
Micrometer API
Just like SLF4J, the mircometer API is a vendor neutral API that can be used to emit observability data. There are several implementations that can be plugged-in. We will be working with micrometer annotations. To enable the micrometer annotations, we need to add the dependency below to our pom file and the later some configuration to our application.properties file
		<dependency>
			<!-- needed for micrometer annotations -->
			<groupId>org.aspectj</groupId>
			<artifactId>aspectjweaver</artifactId>
			<version>1.9.22.1</version>
			<scope>runtime</scope>
		</dependency>
Add the following to the application.properties file
micrometer.observations.annotations.enabled=true
management.observations.key-values.application=${spring.application.name:}
In line 1 above, observation annotations are enabled. However they also require the aspectj dependency. On line 2 a custom tag called application is configured to be added with every metric created by the observation API. management.metrics.tags.application=${spring.application.name:} and management.observations.key-values.application=${spring.application.name:} will make all metrics have the tag `application=”appName”` where appName is the value of the property spring.application.name that is configured in the application.properties file
Loki
Loki is a log aggregator that indexes a set of labels for each log stream sent to it. It is part of the grafana stack. Logs can be pushed to loki or they can be pulled. We will use the loki4j library to push logs to loki.
Add the following dependency
		<dependency>
			<groupId>com.github.loki4j</groupId>
			<artifactId>loki-logback-appender</artifactId>
			<version>1.6.0</version>
		</dependency>
Next, add the logging configuration to the logback-spring.xml file.
<?xml version="1.0" encoding="UTF-8"?>
<configuration>
    <include resource="org/springframework/boot/logging/logback/base.xml"/>
    <springProperty scope="context" name="appName" source="spring.application.name"/>

    <appender name="LOKI" class="com.github.loki4j.logback.Loki4jAppender">
        <metricsEnabled>true</metricsEnabled>
        <http>
            <url>http://localhost:3100/loki/api/v1/push</url>
        </http>
        <format>
            <label>
                <pattern>application=${appName},host=${HOSTNAME},level=%level"</pattern>
            </label>
            <message>
                <pattern>
                    {
                    "@timestamp":"%d{${LOG_DATEFORMAT_PATTERN:-yyyy-MM-dd'T'HH:mm:ss.SSSXXX}}",
                    "level":"%level",
                    "class":"%logger{36}",
                    "thread":"%thread",
                    "message":"%message",
                    "traceId": "%X{traceId:-}",
                    "spanId":"%X{spanId:-}",
                    "pid":"${PID:-}"
                    }
                </pattern>
            </message>
            <sortByTime>true</sortByTime>
        </format>
    </appender>

    <root level="INFO">
        <appender-ref ref="LOKI"/>
    </root>
</configuration>
On line 13, a set of labels are configured. All logs going to loki will have the labels. Loki uses labels to index logs. This implies that we will be able to search for logs by giving in the labels defined above and their values. The labels should be of low cardinality (i.e they should have a limited number of possible values) or else it will make loki slow.
Prometheus
Prometheus is an open source monitoring system that collects metrics data and stores it in a time series database. Prometheus will scrape metric data from our application through an endpoint exposed by actuator. It allows you to query metrics and do basic visualizations.
We will create a docker folder in the root of our application, put a prometheus folder in it and then add a prometheus.yml file with the configuration displayed below. When we run a prometheus docker container, we will mount the file as the configuration.
global:
  scrape_interval: 2s
  evaluation_interval: 2s

scrape_configs:
  - job_name: 'prometheus'
    static_configs:
      - targets: ['localhost:9090']
  - job_name: 'metricsdemo'
    metrics_path: '/actuator/prometheus'
    static_configs:
      - targets: ['host.docker.internal:8080'] ## only for dev purposes on mac/windows don't use host.docker.internal in production
Above, prometheus is configured to scrape from itself (Prometheus also exposes data about itself) at the default endpoint /metrics and from the actuator/prometheus endpoint every 2 seconds. In other words the configuration has 2 scraping jobs. A job is scraping via the URL: http://localhost:9090/metrics. and another via host.docker.internal:8080/actuator/prometheus. For more details see the official documentaton and the minimal configuration.
We also need the following dependency
		<dependency>
			<groupId>io.micrometer</groupId>
			<artifactId>micrometer-registry-prometheus</artifactId>
			<scope>runtime</scope>
		</dependency>
Tempo
Tempo is a long-term storage platform for trace data. Tempo lets you query traces, generate metrics from spans, and link your tracing data with logs and metrics. We will use the brave library to send traces to tempo.
Create a tempo folder in the docker folder and then add a tempo.yml file with the configuration displayed below. When we run a tempo docker container, we will mount the file as the configuration.
server:
  http_listen_port: 3200

distributor:
  receivers:
    zipkin:

storage:
  trace:
    backend: local
    local:
      path: /tmp/tempo/blocks
Above, tempo is configured to listen on port 3200, receive trace data in any supported zipkin format and to store the time series data in `/tmp/tempo/blocks .
Now add the following dependencies in order to send the traces to tempo.
		<dependency>
			<groupId>io.micrometer</groupId>
			<artifactId>micrometer-tracing-bridge-brave</artifactId>
		</dependency>
		<dependency>
			<groupId>io.zipkin.reporter2</groupId>
			<artifactId>zipkin-reporter-brave</artifactId>
		</dependency>
Grafana
This is a visualization tool. It will be used to query logs, metrics and traces as well as for visualization. The logs will come from tempo, metrics from prometheus and traces from tempo.
The code
The code provided show-cases programmatic as well as annotated observability. For annotated observability, the BookResource controller that calls the BookService which in turn calls the BookRepo. For programmatic observability, the BookResource controller invokes a delegate (MyCustomObservation) which in turn calls the BookService.
It is important to note that each HTTP request is intercepted at the filter level and trace information is created. Spring then creates the corresponding the root span for the controller method. If we want to trace the request within our monolith, we have to explicitly annotate our methods or programmatically observe them.
Programmatic observation
Let’s have a look at the programmatic invocation in the MyCustomObservation class below.
    public int countBorrowedBooksProgrammaticObservation() {
        final AtomicInteger atomicInteger = new AtomicInteger() ;
        Observation.createNotStarted("programmatic-observation", this.observationRegistry)
                   .lowCardinalityKeyValue("observe", "prog")
                   .observe(() -> {
                       atomicInteger.getAndSet(bookService.getBorrowedBooksCount());
                       logger.info("custom observation done");
                   });
        return atomicInteger.get();
    }
In lines 3-8 we see bookService.getBorrowedBooksCount()being wrapped with in an observation.
Annotated observation
Below is a method annotated with @Observed. The annotation creates a corresponding span when the method is invoked by a controller method.
    @Observed
    public int booksCountObservedAtServiceAndRepo() {
        logger.info("In booksCountObservedAtServiceAndRepo method");
        return bookRepo.getReservedCountObserved();
    }
Running and Observing
Below are the steps to run and observe the application:
- docker compose up (First navigate from the terminal to the root folder of the project)
- mvn spring-boot:run (From root folder)
- Invoke the bookResource endpoints using the following base uri: http://localhost:8080/v1/book
- Open grafana (http://localhost:3000) and observe
Let’s have a look at a few endpoints and their output when invoked.
/v1/book/borrowerd0
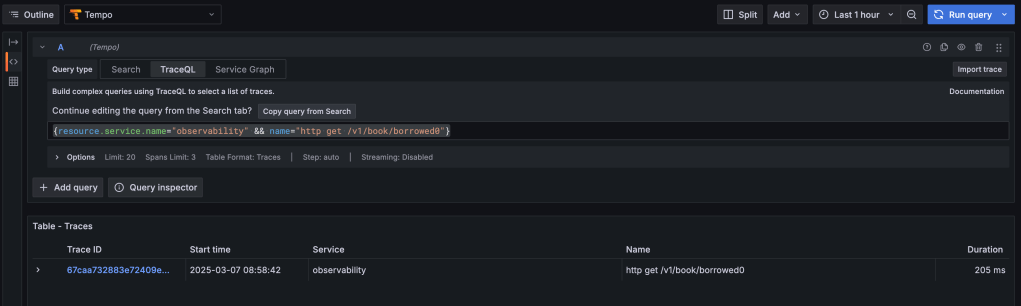
For this endpoint, the controller calls the bookService method (getBorrowedBooksCount) which is not observed. The bookService in turn calls the bookRepo method (getReservedCount) which is also not observed. So if we invoke this endpoint, the trace will contain only one span and that is the span of the controller method.
Now open grafana and click the explore tab . Give in the following traceQL query {resource.service.name="observability" && name="http get /v1/book/borrowed0"}
You should now see the results similar to what is depicted below.
When you click on the trace id of the entry in the traces table, you get the span details displayed in the pane on the right as shown below.
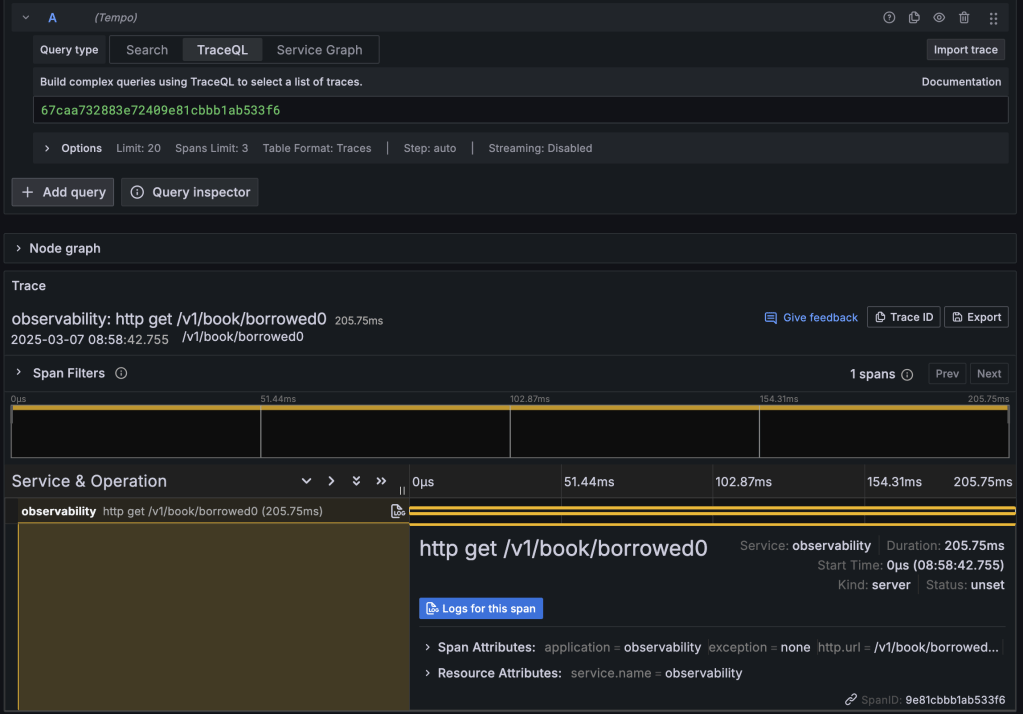
Now click on the blue button titled “Logs for this span” and you will be able to see all logs related to that span. From the logs you can also click the button titled “Tempo” (see image below) to go back to the traces
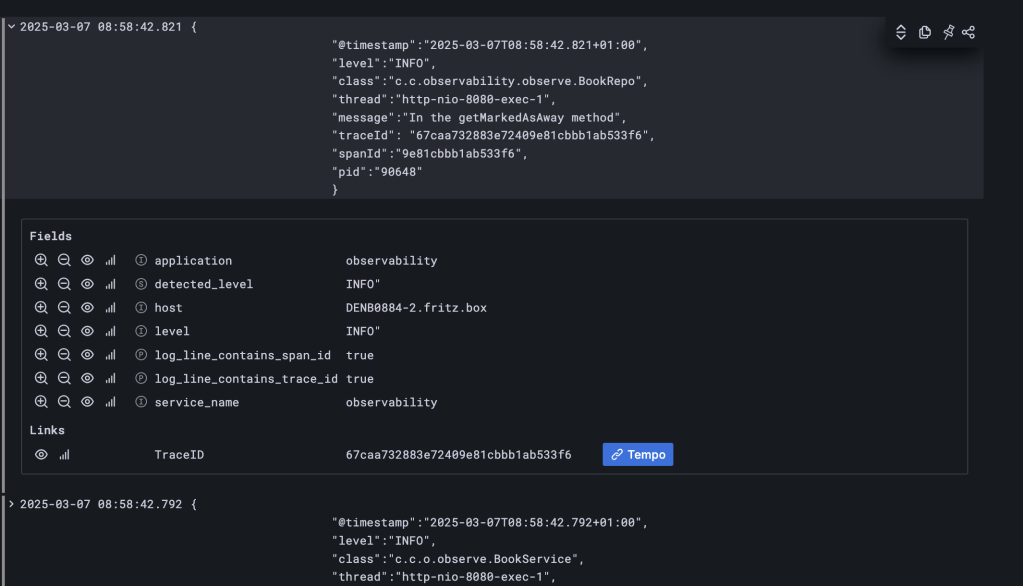
In the datasource file (datasource.yml found in the docker folder) you can see the configuration that makes the jump from loki to tempo possible. See the snippet below
      derivedFields:
        -   datasourceUid: tempo
            matcherRegex: \"traceId\":\s*\"(\w+)\"
            name: TraceID
            url: $${__value.raw}
For the jump from tempo to loki you have the following
      tracesToLogs:
        datasourceUid: 'loki'
        spanEndTimeShift: 30m
        spanStartTimeShift: -30m
        filterByTraceID: true
        filterBySpanID: true
To see the related metrics, you can go to the prometheus search and give in the following promQl query http_server_requests_seconds_count{uri="/v1/book/borrowed0"}. Also select the “lines” graph to have a view of the number of requests done to that endpoint over time.
/v1/book/borrowerd1
For this endpoint the controller invokes the bookService method borrowedBooksCountObservedOnlyAtService which is observed. However it calls the bookRepo method (bookRepo.getReservedCount) which itself is not observed. So you should expect to see just 2 spans
Conclusion
We have seen how to make our application observable using spring boot and how to use the grafana stack to observe the application. There is an accompanying bitbucket repository which you can use to follow the tutorial.

Leave a reply to Data Access Observability – Code Major Cancel reply